Fire Statistics
Fire Damaged Properties Statistic
※ Note: The statistics were produced on April. 30, 2026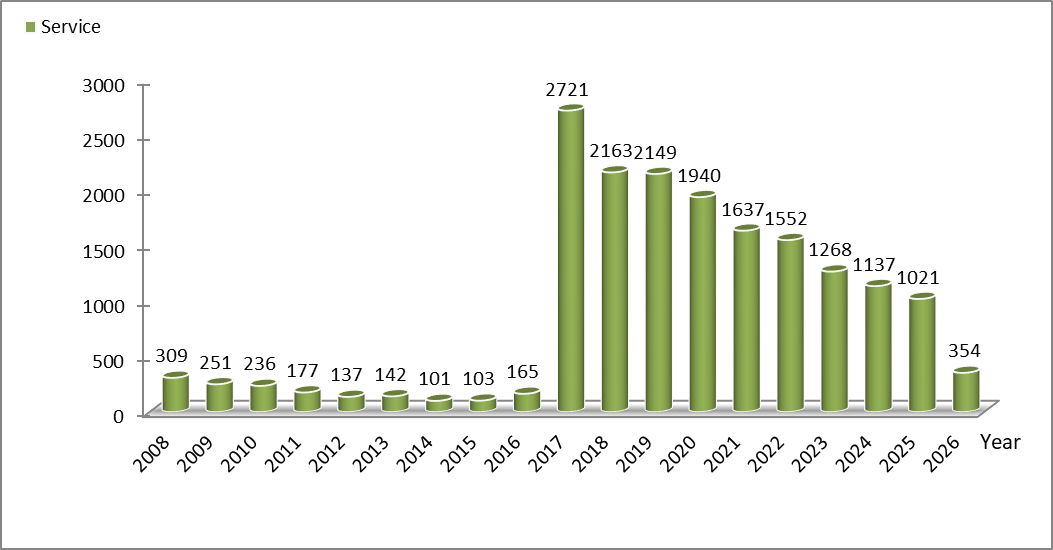 Fire Service Statistics
Year 2007 2008 2009 2010 2011 2012 2013 2014 Service 309 309 251 236 177 137 142 101 Year 2015 2016 2017 2018 2019 2020 2021 2022 Service 103 165 2721 2163 2149 1940 1637 1552 Year 2023 2024 2025 2026 Service 1268 1137 1021 354 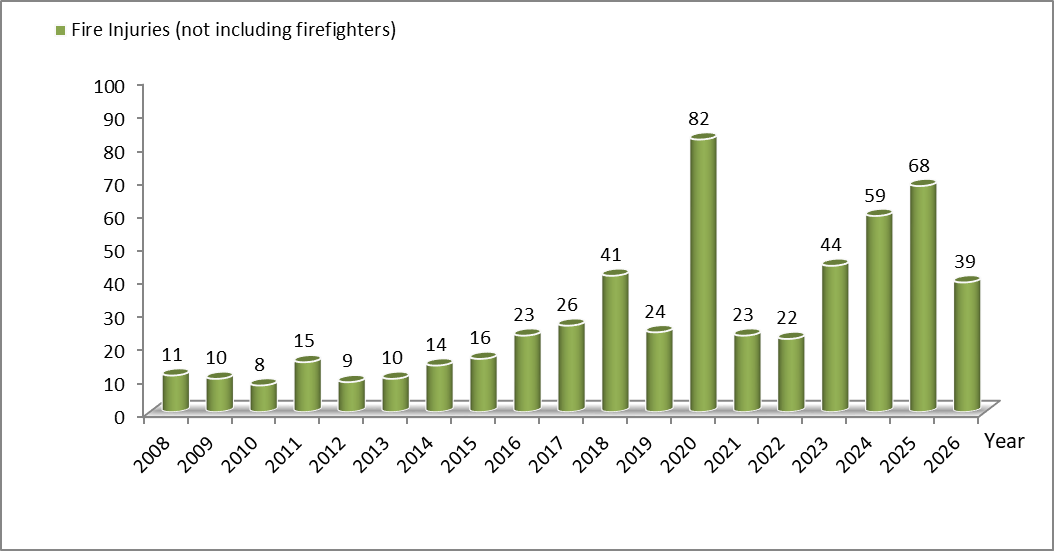
Year 2007 2008 2009 2010 2011 2012 2013 2014 Number of Injuries 7 11 10 8 15 9 10 14 Year 2015 2016 2017 2018 2019 2020 2021 2022 Number of Injuries 16 23 26 41 24 82 23 22 Year 2023 2024 2025 2026 Number of Injuries 44 59 68 39 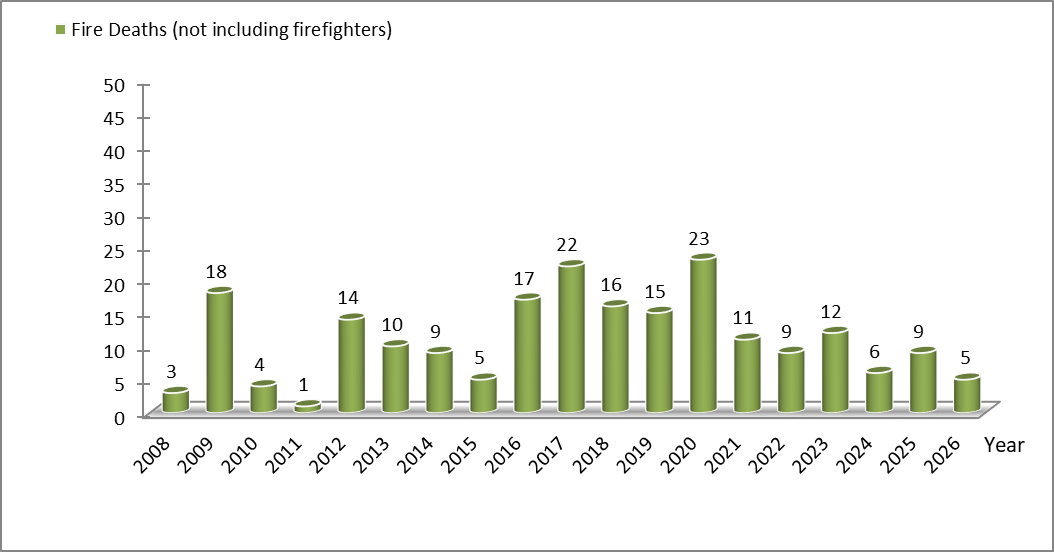 Fire Deaths Statistic
Year 2007 2008 2009 2010 2011 2012 2013 2014 Number of Deaths 4 3 18 2 1 14 10 9 Year 2015 2016 2017 2018 2019 2020 2021 2022 Number of Deaths 5 17 22 16 15 23 11 9 Year 2023 2024 2025 2026 Number of Deaths 12 6 9 5 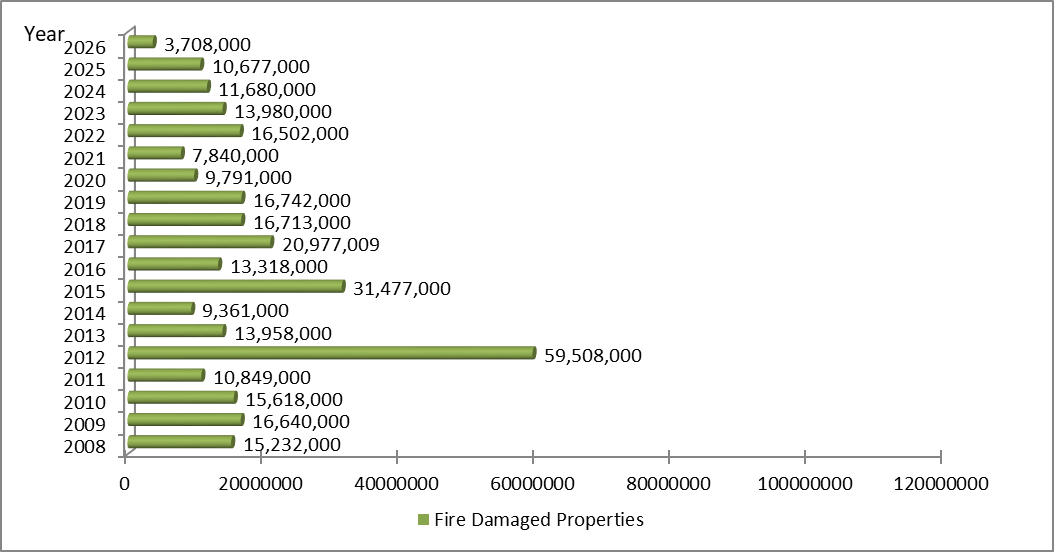
Year 2007 2008 2009 2010 2011 Fire Damaged Properities 17,894,000 15,232,000 16,640,000 15,618,000 10,849,000 Year 2012 2013 2014 2015 2016 Fire Damaged Properities 59,508,000 13,958,000 9,361,000 31,477,000 13,318,000 Year 2017 2018 2019 2020 2021 Fire Damaged Properities 20,977,009 16,713,000 16,742,000 9,791,000 7,840,000 Year 2022 2023 2024 2025 2026 Fire Damaged Properities 16,502,000 13,980,000 11,680,000 10,677,000 3,708,000

![Taiwan.gov.tw [ open a new window]](/images/egov.png)