Current Emergency Medical Services Statistics in Taipei 2024 (Updated on Oct. 2024)
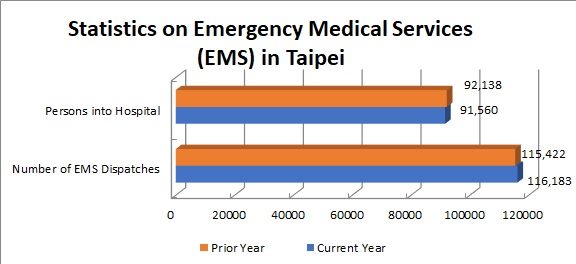
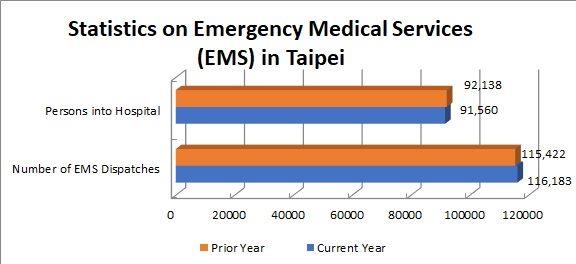
Class | Number of EMS Dispatches | Number of People Hospitalized | non-trauma | trauma |
EMS StatisticsCurrent Month | 11,185 | 8,988 | 5,516 | 3,472 |
---|
Prior Month | 11,364 | 8,861 | 5,364 | 3,497 |
---|
comparison | 179 | -127 | -152 | 25 |
---|
Current Year | 116,183 | 91,560 | 57,690 | 33,870 |
---|
Prior Year | 115,422 | 92,138 | 57,905 | 34,233 |
---|
Comparison | 761 | -578 | -215 | -363 |
---|
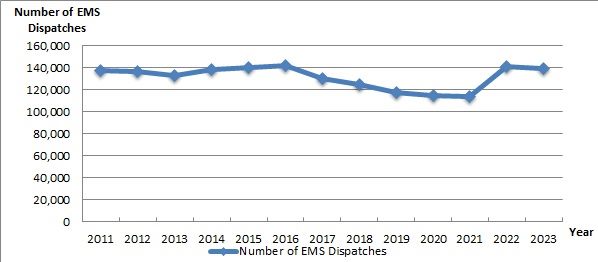
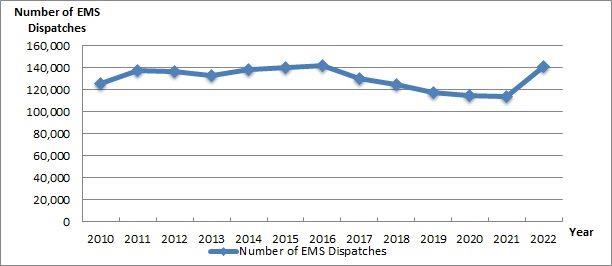
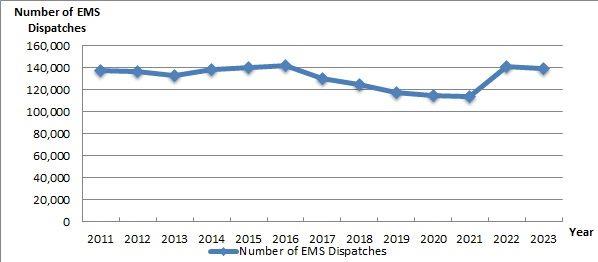
Number of EMS Vehicles Dispatched by Taipei City Fire Department from 2009 to 2022
Year | 2009 | 2010 | 2011 | 2012 | 2013 | 2014 | 2015 |
---|
Number of EMS Dispatches | 112,599 | 125,204 | 137,310 | 135,920 | 132,573 | 138,452 | 140,160 |
---|
Year | 2016 | 2017 | 2018 | 2019 | 2020 | 2021 | 2022 | 2023 |
---|
Number of EMS Dispatches | 141,470 | 129,723 | 124,922 | 117,683 | 114,343 | 113,864 | 140,618 | 138,712 |
---|
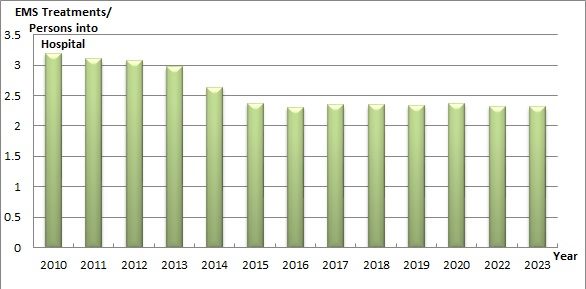
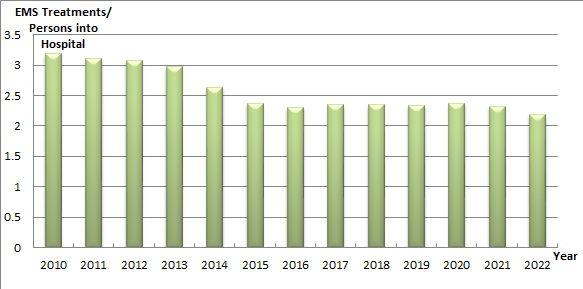
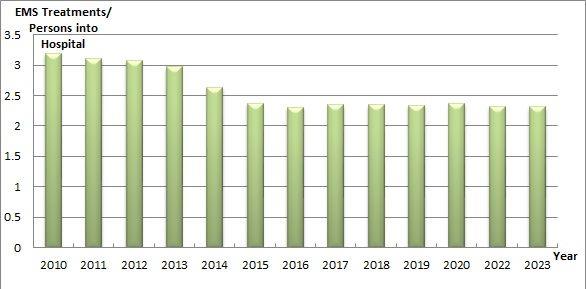
Statistics on EMS Treatments from 2009 to 2022, released by the Taipei City Fire Department
Year | 2009 | 2010 | 2011 | 2012 | 2013 | 2014 | 2015 |
---|
EMS Treatments | 3.214 | 3.191 | 3.107 | 3.081 | 2.974 | 2.638 | 2.372 |
---|
Year | 2016 | 2017 | 2018 | 2019 | 2020 | 2021 | 2022 | 2023 |
---|
EMS Treatments | 2.307 | 2.345 | 2.348 | 2.337 | 2.376 | 2.323 | 2.181 | 2.317 |
---|